IIS logging to the ELK stack
Our Exchange 2013 servers had a near-meltdown last week due to no free disk space on the C: drive, which would have been pretty catastrophic if we didn’t have the appropriate monitoring in place. After some investigation, I found that the IIS instances on the boxes had been happily logging away since we implemented them and the log directories had grown to a gigantic 40gb each. Not happy with just deleting them, I figured I would ship them to our logging server and delete them from the servers themselves.
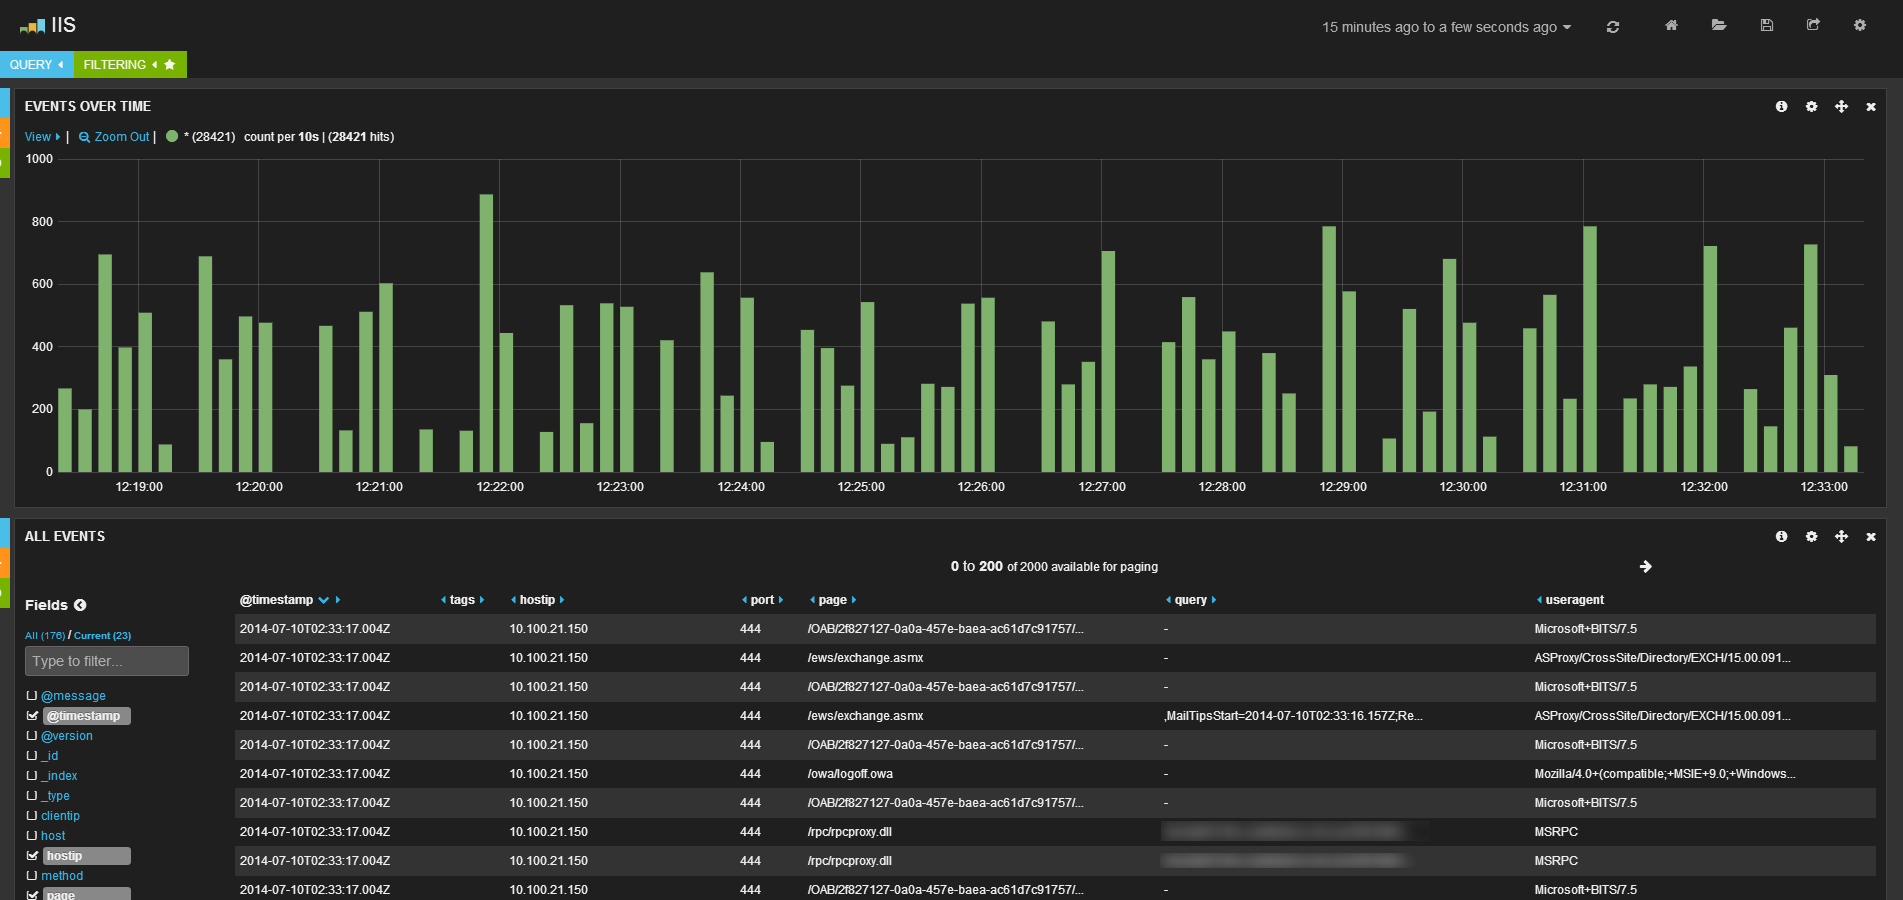
I have been using the ELK stack (Elasticsearch, Logstash, Kibana) for about a year now and it’s been great. Logs are searchable and if any issues arise we can quickly pinpoint exactly what has been happening over a number of devices over that time, such as switches, wireless access points, firewalls, Windows servers etc.
Logging input
First, you will need to install a log shipper on the Windows server. I went with nxlog as it has good support and it seems to be what everybody else uses on Windows. As a bonus, it doesn’t require Java to be installed unlike Logstash. Download the installer from the nxlog website and install it to the machine. After it is installed, open C:\Program Files (x86)\nxlog\conf\nxlog.conf and put the following in:
|
|
Make sure you replace <LOGSTASH_IP> with your Logstash servers’ IP address.
Logging Output
I won’t go in to deploying the ELK stack as there are a tonne of guides available. Make sure it all works before proceeding below.
On the Logstash instance in your logstash.conf, place the following:
|
|
Again, make sure you replace <ELASTICSEARCH_IP> with your Elasticsearch servers’ IP address.
After you have done all this, start nxlog on your Windows server with Start-Service nxlog in a PowerShell prompt and watch the logs pour in to your ElasticSearch instance.
Truncating IIS logs
This part is easy. Just set up a scheduled task to run the following PowerShell command:
Get-ChildItem -Path C:\inetpub\logs\LogFiles -Recurse | ? {$_.PSIsContainer -eq $false -and $_.lastwritetime -lt (get-date).adddays(-15)} | Remove-Item -Force
This may vary if you have chaned the logging directory and if you want to keep the files longer than 5 days.